What happens to a stock after a paid promotion?
Our record of disclosed promotions, measured: how far promoted stocks typically run, how much they give back by the end of the window, and how often the gain holds.
- Reading time
- 4 min read
- Published
- Sections
- 8 sections
On this pageHow we measure a promotion
Every promotion email tells you what the stock is about to do. This guide shows what promoted stocks actually did, measured across every disclosed promotion in our record that has finished. It's backtested history: a description of past campaigns, not a prediction about the next one, and not a reason to buy or sell anything.
Figures as of October 20, 2026, covering every ended deal in our record with usable price data, for promotions that started between March 2014 and October 2026. They're recalculated as new deals close.
How we measure a promotion
Each figure below is per deal, not per email. One campaign is usually carried by many newsletters, so we first collapse every newsletter's disclosure of the same campaign into a single deal, keyed on the ticker and the start of its promotion window (see deal). Counting per newsletter would let a campaign that ran on ten lists count ten times.
- Entry is the first tradable print after the disclosure, not the window's start date. Disclosures often land in the evening, and the window's start date would count trading that happened before anyone could have known.
- Peak is the highest print inside the deal's own window, read from one-minute bars that include pre-market and after-hours trading. That matters: many of these stocks print their high before the regular session opens.
- Fade is how much of that peak was given back by the close on the window's last day.
- Window return is entry to that same window-end close.
How one deal is measured
- Entry
- first tradable print
- Peak
- highest print in the window
- Peak run
- entry to peak (median +9%)
- Fade
- peak to window-end close (median 10%)
Only deals whose window has ended are included, so every outcome is final. The full definitions are on the methodology page.
How far promoted stocks ran
The median deal's peak was +9% above its entry price. 47% of deals reached at least +10% at some point in their window, 27% reached +20%, and 10% reached +50%.
Speed matters as much as size: 63% of deals printed their high on the very first session after the disclosure (counting pre-market and after-hours trading as part of that session).
From our record
Median peak run: +9% above entry
Read those carefully. A peak is the single best print in the window, which is a price almost nobody actually sold at. It's the ceiling of what was possible, not what a typical buyer got. Our definition of a hit uses the +10% bar for exactly that reason: a stock that only ticked green wasn't a run anyone could plausibly have traded.
What happened after the peak
From that peak, the median deal had given back 10% by the close on the last day of its window. Measured from entry to that window-end close, the median deal returned -1%, and only 44% of deals closed their window above the price they entered at.
From our record
- Median given back from the peak
- 10%
- Median entry to window-end return
- -1%
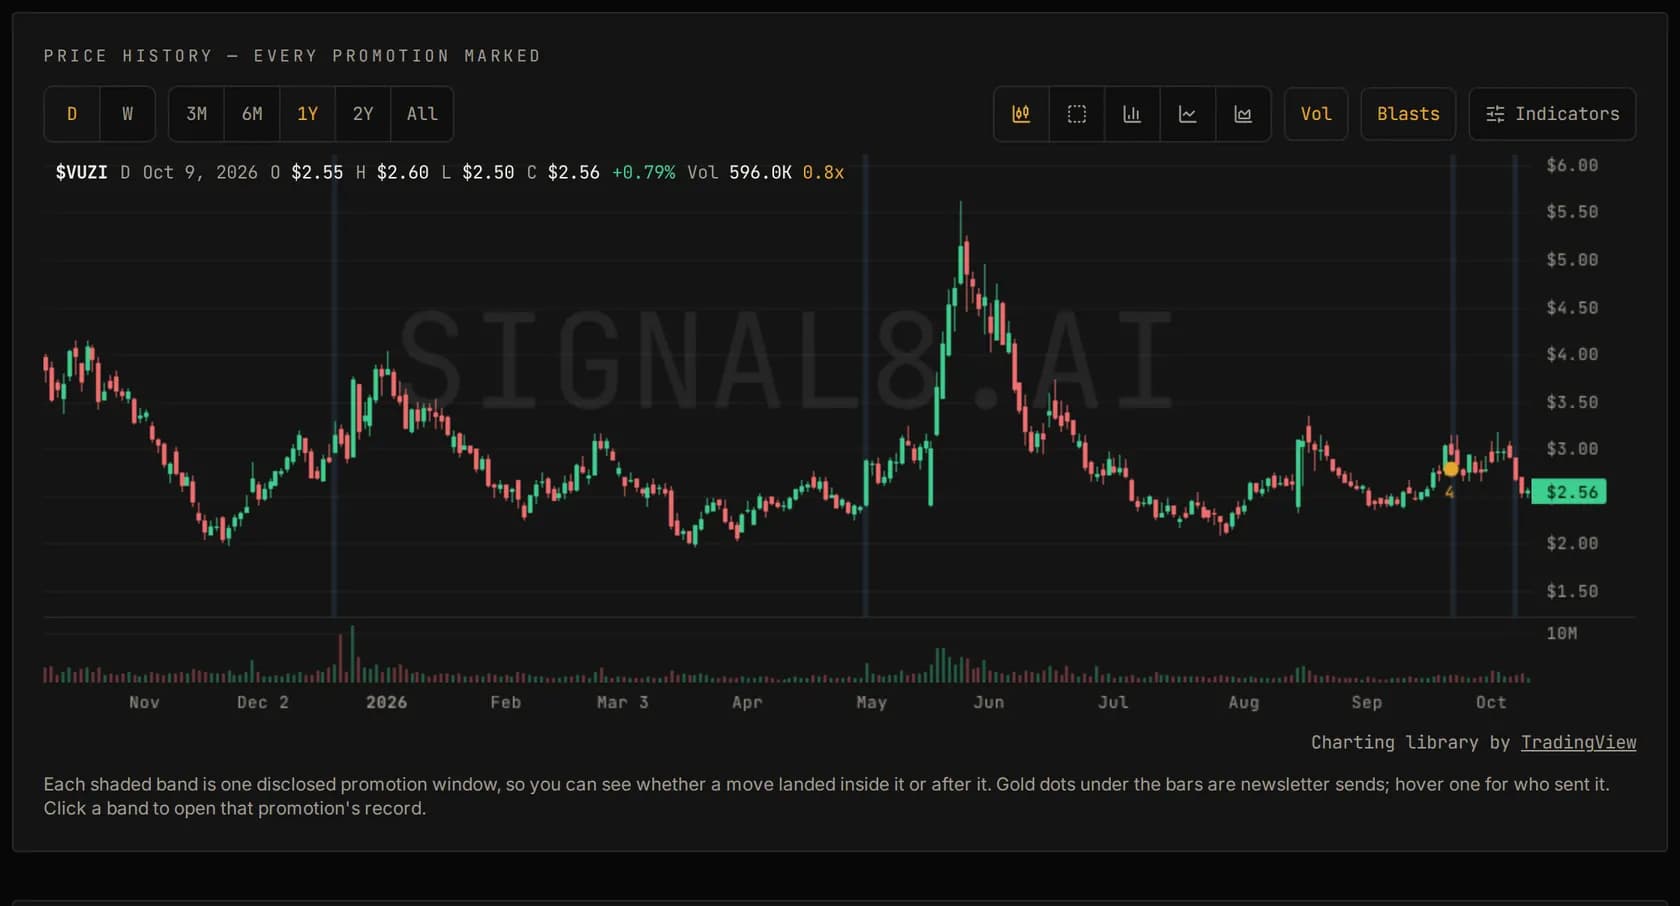
The gap between a deal's peak and its window-end close is the part of the record the promotion emails never mention, and you can see it on the price chart of any of the ticker pages. The disclosed end date isn't a signal that the price falls, but it is the date after which nobody is being paid to keep the stock in front of readers.
Volume is the real tell
On the first session the promotion could affect, the median deal traded 1.4x its own normal daily volume (normal meaning its median over the roughly 30 trading days before the promotion).
Percentage moves in small stocks can mean very little on their own. A stock that normally trades a few thousand shares can jump a long way on almost no activity. Volume against the stock's own baseline is what shows that real money arrived, and it's also what makes it possible for anyone holding shares, or with an open offering, to sell. Our research guide explains why that matters to whoever funded the campaign.
Why the real picture is worse than these numbers
19% of the ended deals we tried to measure had no usable price data at all: the stock was halted, delisted, or traded too thinly to price. Those deals are left out of every figure above, and a stock that stopped trading is rarely one whose holders did well.
What these figures don't tell you
- They aren't a forecast. Past campaigns don't predict the next one, and the mix of operators, sectors and market conditions changes over time.
- They aren't a trade you could have made. Entry is the first print, which you'd rarely get. Spreads in these stocks are wide and depth is thin, so real fills are worse in both directions.
- They're medians. Half of deals did better and half did worse, and the spread between the best and worst is enormous.
- They don't separate campaign types. A single newsletter placement and a fourteen-list campaign are both one deal here. Each operator's own campaign history is on its operator page.
Reading a single deal the same way
Every ticker's page shows its price chart with each disclosed campaign marked on it, and paid accounts also see these measurements deal by deal, so you can compare any one campaign with the record as a whole. Three questions do most of the work:
- How did its peak compare with the median above, and how fast did it get there?
- How much of that peak was still there at the window's last close?
- Was the stock's volume many times its normal level, or was the move made on the usual trickle?
A deal that ran further than most and held more of it is unusual by this record's standards. A deal that looks typical probably was.
How to use this in your own research
When a promoted stock lands in your inbox, the useful question isn't "will this go up?" It's "what have campaigns like this done before?" Look the symbol up in the promoted tickers index to see whether it's been promoted before and what happened, check the paying party's history on the operators index, and run through the red flags checklist before anything else.
Common questions
Do promoted stocks go up?
Some run and some don't, and a high printed during the window is a different thing from a gain that lasted. This page measures both across every ended deal in our record: how far the typical deal ran from its entry, and how much of that was left at the close on the window's last day. Past outcomes don't predict any single campaign.
When do promoted stocks usually peak?
We measure the peak from one-minute bars that include pre-market and after-hours trading, because many promoted stocks are disclosed in the evening and trade heavily before the next regular session opens. The share of deals that peaked on their first session is reported in the figures on this page.
Why are statistics on promoted stocks too optimistic?
Because stocks that are halted, delisted or stop trading have no clean price to measure, so they fall out of the averages. Those are often the worst outcomes, which leaves the published figures looking better than reality.
Educational content only. Nothing here is investment advice, a recommendation to buy or sell any security, or a prediction about any stock. paidpromotracker reports disclosed public information and doesn't evaluate the merits of any company or campaign. See the full disclaimer.